Tables are created
Just as with the function <group> it is only possible to change the presentation by adding a table. This enables parameters to be combined together. In addition, a more manageable summary of the variables is achieved.
Regarding the table, it must be taken into account that the parameters are listed separately in relation to table column (td) and
table row (tr). In the fields the functions <choice>, <double> or <integer> can be integrated again in order to determine the variable value.

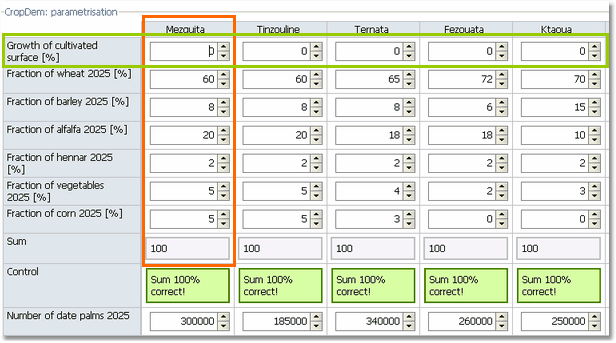
Exemplified table within the GUI containing integers in each single cell
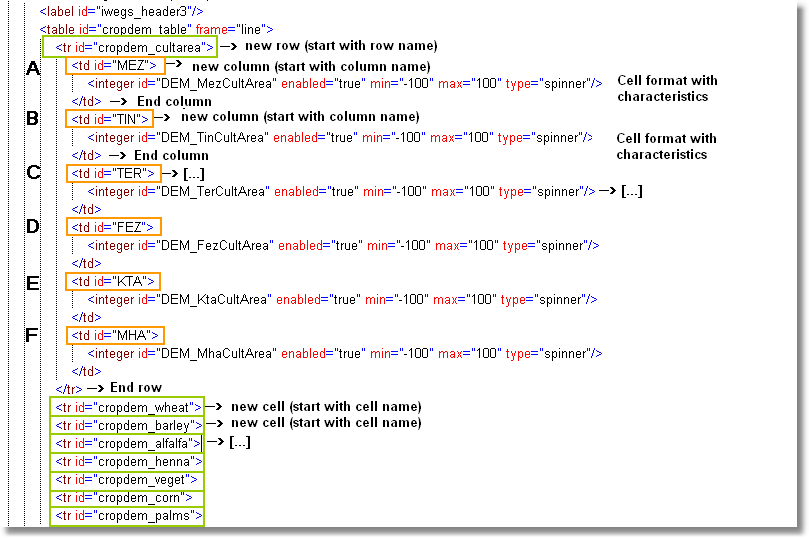
The presentation of the table form as employed in the GUI is created in an interactive form. In the XML file the arrangement i.e. the number of rows and columns as well as the functional area of the cells, appear in a hierarchical order one below each other. A tag of a new table row is initiated with <tr id = ...>.
In the figure below the structure for one (!) single row is marked and described; the same structure is employed for every table row and its corresponding allocation in the XML file.

Overview of the XML structure of the table. The colours correspond to the frames used in the above screenshot.
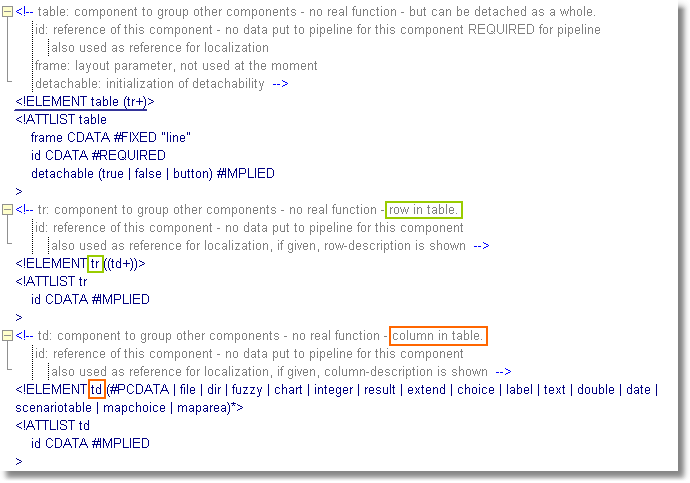
The description of the table with regard to rows and columns is also listed in the DTD structure. The colour labelling is maintained in order to allow a direct comparison between the three levels, DTD, XML and the form components employed in the system.

Guide to create the form component <table> within the system