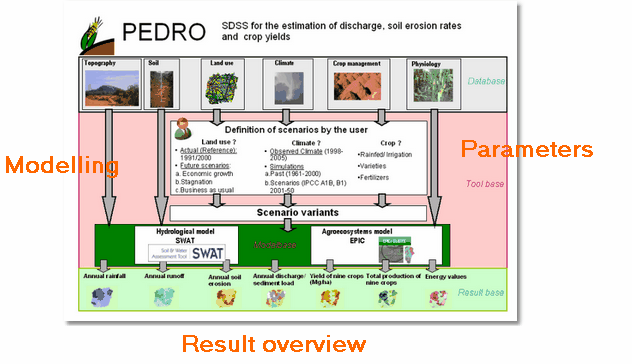
The main graph: an initial summary
The main graph, which appears between the Welcome Screen and the Parameterisation, gives the user a summary of the interaction between the database, the variables, the Toolbase and the process of modelling. This avoids the need for long explanations and complicated wording.
Structure of the system |
-long version-
|
Question |
|
Description of the (Geo) Data/Metadata |
Content of the SDSS |
Models |
SWAT, IWEGS, ...
|
Quintessence |
|
User orientation |
|
Where can the process be influenced? |
|
Special information |
|

Example of a block diagram which gives an overview at the beginning of each parameterisation